
Most chess sites limit free game review for a boring reason: running a chess engine over every move of every game costs real CPU, and someone has to pay for it. If a review takes 20 seconds of server compute and you have 40,000 of them a day, you have a bill.
We started Chessigma in March 2025 because players kept complaining about that limit. The trick that makes it free and unlimited is not clever. The engine is compiled to WebAssembly and runs in your browser tab, on your own device. Our server fetches the game, works out a few stats at the end and stores the result. Today that's over a million reviews a month, and the expensive part of each one runs on somebody else's CPU.
That part worked on day one. What I didn't expect is how much of the next year would go into one question: how do you tell a slow run from a dead one, on a device you can't see?
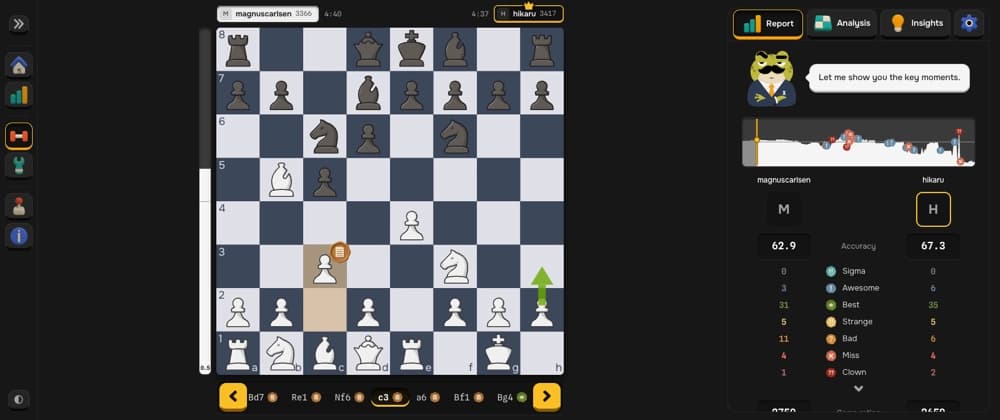
Mobile gets one worker. Desktops with more than four cores get two. Nothing fancy, and it has held up. (Sigma and Clown are our move labels. A friendly trademark chat with Chess.com meant we couldn't borrow theirs, so a blunder here is a Clown. Nobody has complained.)
The cost side is exactly what you'd hope. The failure side is where it gets interesting, because when the work runs on someone else's device, every failure happens somewhere you have no logs.
On a server, a job that dies usually tells you. In a browser tab on a cheap Android phone, a lot of things just... stop: The .wasm starts downloading, the connection drops halfway, and the worker never says a word. The OS freezes the WebView when the user switches apps. Your timers stop. When they come back, it looks like nothing happened for two minutes. The runtime traps inside the engine on some devices, and the worker goes quiet. The engine is fine, but it's slow, because it's a four-year-old phone on a train.
So we had a watchdog. It polled every two seconds, and if the analysis looked stuck, it gave up on the run. Reasonable. Here is the line that decided "stuck":
Read it slowly. It keeps waiting only if progress moved recently and the whole run is under 60 seconds. So any review that took longer than a minute got killed, even if it was moving along happily. A long game on a slow phone takes longer than a minute. That's not a stall, that's just a phone.
It got worse. Giving up flipped the "analyzing" flag off without ever setting "ready", so the UI moved on to the report screen and rendered its initial state. Every accuracy was zero, every move count was zero. It looked like the engine had produced garbage. It hadn't produced anything.
A user wrote in: "analysis stops, no move classifications". When I went to the data: The watchdog fired about 3,100 times in 14 days. At the moment it fired, the median run was 48.66% done. These were healthy runs, cut in half. In the mobile app, where the watchdog was switched on, 39.8% of users hit at least one failed analysis in those two weeks. Almost all of them on Android.
My first theory was wrong. I was sure we were saving corrupted engine output and serving it back from a cache. We weren't: the game in the report had zero analysis rows. The bug was one &&.
The rewrite had one rule. Elapsed time only means something before progress has ever moved. Once the engine has reported anything, the only clock that matters is "time since the last progress".
I pulled the decision out of the React hook into a pure function with no timers, no React and no imports, so it can be tested in plain Node:
(Trimmed. The real one also handles "engine never said it was ready" and returns how far over budget it was, for telemetry.)
The part I'm happiest with is that every budget now has its arithmetic written next to it instead of being a round number someone liked: Boot, 90 s. 7.28 MB is 58 Mbit. At a sustained 1 Mbps that's 58 seconds of download, plus a few seconds to compile the wasm on a mid-range Android, plus the handshake and the first position. About 65 seconds at the slow end. 90 gives headroom, and below roughly 0.7 Mbps the download genuinely can't finish, so saying so is the right answer. Engine stall, 20 s. Progress fires once per position, and the engine's own per-position timeout tops out around 14 seconds at the depth we use. A CI check pins that relationship, so if someone raises the depth later, the build fails instead of the watchdog quietly killing slow runs again. Network stall, 45 s. After the engine phase, the gaps are HTTP calls with retries. Three attempts that each hit a 14 s function timeout, plus backoff, is 43 seconds.
And because it's a pure function, I could do the one test that matters: put the old 60-second cap back in and watch CI go red.
All of this assumes the engine file actually reaches the device. Around the same time we learned how optimistic that was, from a completely different direction.
In April we moved every static asset (JS, CSS, the engine) to a CDN on a separate domain. Standard assetPrefix stuff. Four months later, someone on our Discord posted a screenshot of the site with no styles at all, on an iPad. Then another one.