
Everyone is building AI agents. Most of them have far more permissions than they should.
One of the biggest questions facing platform engineering teams today is not whether AI can help operate production systems. The real question is: how do you prevent an AI agent from becoming the next privileged insider threat?
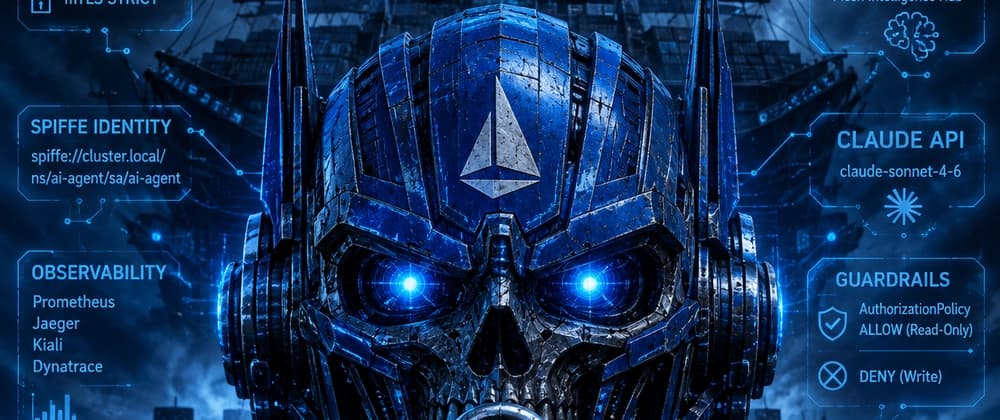
I wanted to explore that problem in a practical way. The result was NEXUS - Mesh Intelligence Hub - an AI-powered operations agent running on Amazon EKS inside an Istio service mesh, designed around a single principle:
The agent should be able to observe everything, understand what is happening, propose a solution, and still be physically unable to touch the workloads it monitors.
Prometheus tells you error rates are increasing. Jaeger shows where requests are failing. Kiali visualises service-to-service communication. Dynatrace correlates application and database activity.
But none of these tools answer the question engineers immediately ask during an incident:
That gap is where NEXUS operates. Its purpose is not to replace engineers. Its purpose is to shorten the path from detection to diagnosis.
The most important design decision was that NEXUS would never be trusted simply because it is AI. Instead, it is treated exactly like any other workload inside the cluster.
The agent runs in its own Kubernetes namespace with a dedicated ServiceAccount and a SPIFFE cryptographic identity:
All communication is protected by Istio mTLS in STRICT mode. An AuthorizationPolicy grants NEXUS read-only access to Prometheus, Jaeger, and Kiali in the istio-system namespace. A separate DENY policy explicitly blocks it from reaching any application workload - lsd-frontend, lsd-backend, payment APIs - everything.
Even if the agent were compromised, the blast radius is intentionally constrained. The service mesh becomes the enforcement layer. The security model is not based on what the agent promises to do. It is based on what the platform physically allows it to do.
Error rate derived from istiorequeststotal p99 latency from the histogram bucket
When error rate exceeds the configured threshold, NEXUS gathers a full telemetry snapshot and submits it to Claude Sonnet 4.6 via the Anthropic API. The prompt mandates structured JSON output - severity, summary, root cause, numbered remediation proposal, a "cannot do" scope boundary, and the role required to approve. No freeform text. No markdown. Structured output consumed directly by the dashboard.
To validate the design I injected a controlled failure using Chaos Mesh. A NetworkChaos fault was applied against the lsd-backend service inside the lsd-payments namespace.
Within a single 30-second polling cycle NEXUS detected a 56.5% error rate with no corresponding frontend degradation. Claude's diagnosis:
Correctly isolated the fault domain to lsd-backend specifically, ruling out mesh-wide or namespace-wide networking issues Identified NaN p99 latency as a broken metrics pipeline signal rather than an application latency problem Produced a 6-step remediation proposal covering pod health inspection, Envoy sidecar log analysis, DestinationRule outlier detection tuning, and Jaeger trace verification Explicitly declared it cannot execute kubectl commands, cannot inspect running pods, cannot modify Istio configuration, cannot change production workloads
The dashboard keeps humans in control. When an incident is detected, three actions are available:
NEXUS AI - Auto-Remediate - Executes a tightly scoped remediation workflow using a ClusterRole limited to chaos-mesh resources. In this environment that means deleting the Chaos Mesh fault object. The agent cannot touch application workloads.