
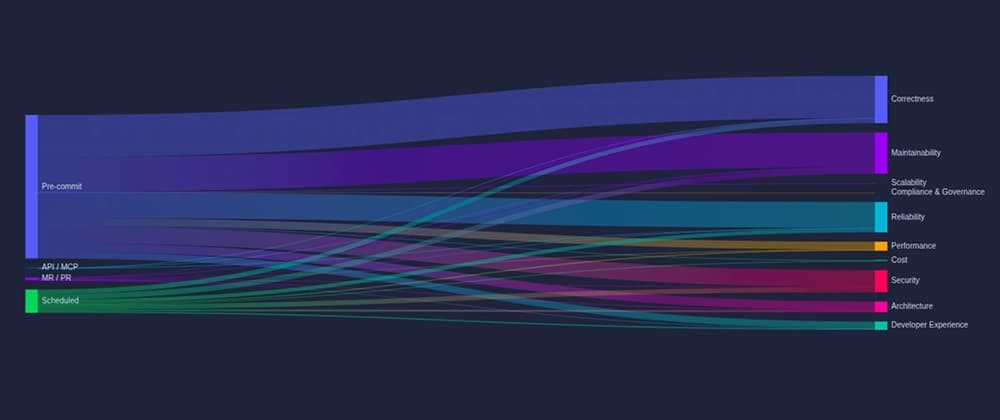
Having data is good. Having a database full of reviews, commits, and org activity sitting there quietly, untouched, unread, never once glanced at by a human being with a coffee and an opinion? That's not "having data." That's a very expensive data graveyard.
At LiveReview, we build what we call a Blast-Radius Aware AI Code Review for Business-Critical Systems.
Which is a fancy way of saying: we review your code, we figure out how bad it would be if a change goes wrong, and we don't shut up about it until someone fixes it.
Along the way we accumulate a review data: who reviewed, how much, how fast, how often, which repos are on fire.
Engineering leaders would ask "is adoption increasing?" and get back a vibe, not an answer.
So we built Livi, a chat bot that answers real questions about that data with real charts, not paragraphs of hedging.
Specifically: why we never let the LLM touch a pixel, how the same chart definition ends up as both a live interactive graph in your browser and a flat PNG in a Slack thread, and why teaching a language model to pick the right chart shape is a surprisingly deep rabbit hole.
The tempting, wrong idea is: "let's have the LLM generate an image." Please don't.
Image-generating models are a different beast entirely, and even if you got one to draw a bar chart, you'd have no way to verify the numbers on it are real.
You'd be trusting a model that hallucinates plausible-sounding review counts to also render them faithfully into pixels.
The actually good idea, and the one every serious LLM-charting integration eventually converges on, is: the LLM writes Vega-Lite, a JSON grammar for describing charts declaratively.
No pixels, no drawing, just a description of what the data means and how it should be mapped to a picture.
The LLM's job shrinks down to something it's genuinely good at: filling in a well-defined schema.
Models are much better at "pick mark: bar or mark: line" than "hallucinate 600 pixels of a correct y-axis."
It writes the SQL, we run it, and the real result set gets stitched into data.values by our own Go code.
What actually happens between "how many reviews last month" and a chart on your screen
A few things worth dwelling on here, because each one exists because something went wrong first.
Why two SQL-writing steps instead of one? Because the model needs to know how many rows the answer will have before it can decide whether a chart makes sense or whether it should hand you a CSV instead.